
Key Takeaway
- 🚰 The gallons-per-day answer, tiered: a medium-sized data center uses about 100 million gallons a year (roughly 300,000 gallons a day), while hyperscale facilities during peak conditions can consume between 1 million and 5 million gallons per day (2026 state water-operators’ association estimates) — and one named flagship got measured: Google’s Council Bluffs, Iowa campus consumed about 980 million gallons in 2023, roughly 21% of the whole city’s water.
- ⛳ The golf-course comparison, checked and corrected: U.S. golf courses use an estimated 2.08 billion gallons per day (Golf Course Superintendents Association figures, about 0.5% of national withdrawals) versus an estimated 449 million gallons per day for U.S. data centers — golf drinks roughly 30× what every data center combined does, nationally; but per-capita the comparison flips (one Virginia Google campus ≈ 1.2 golf courses of annual water serving millions of people).
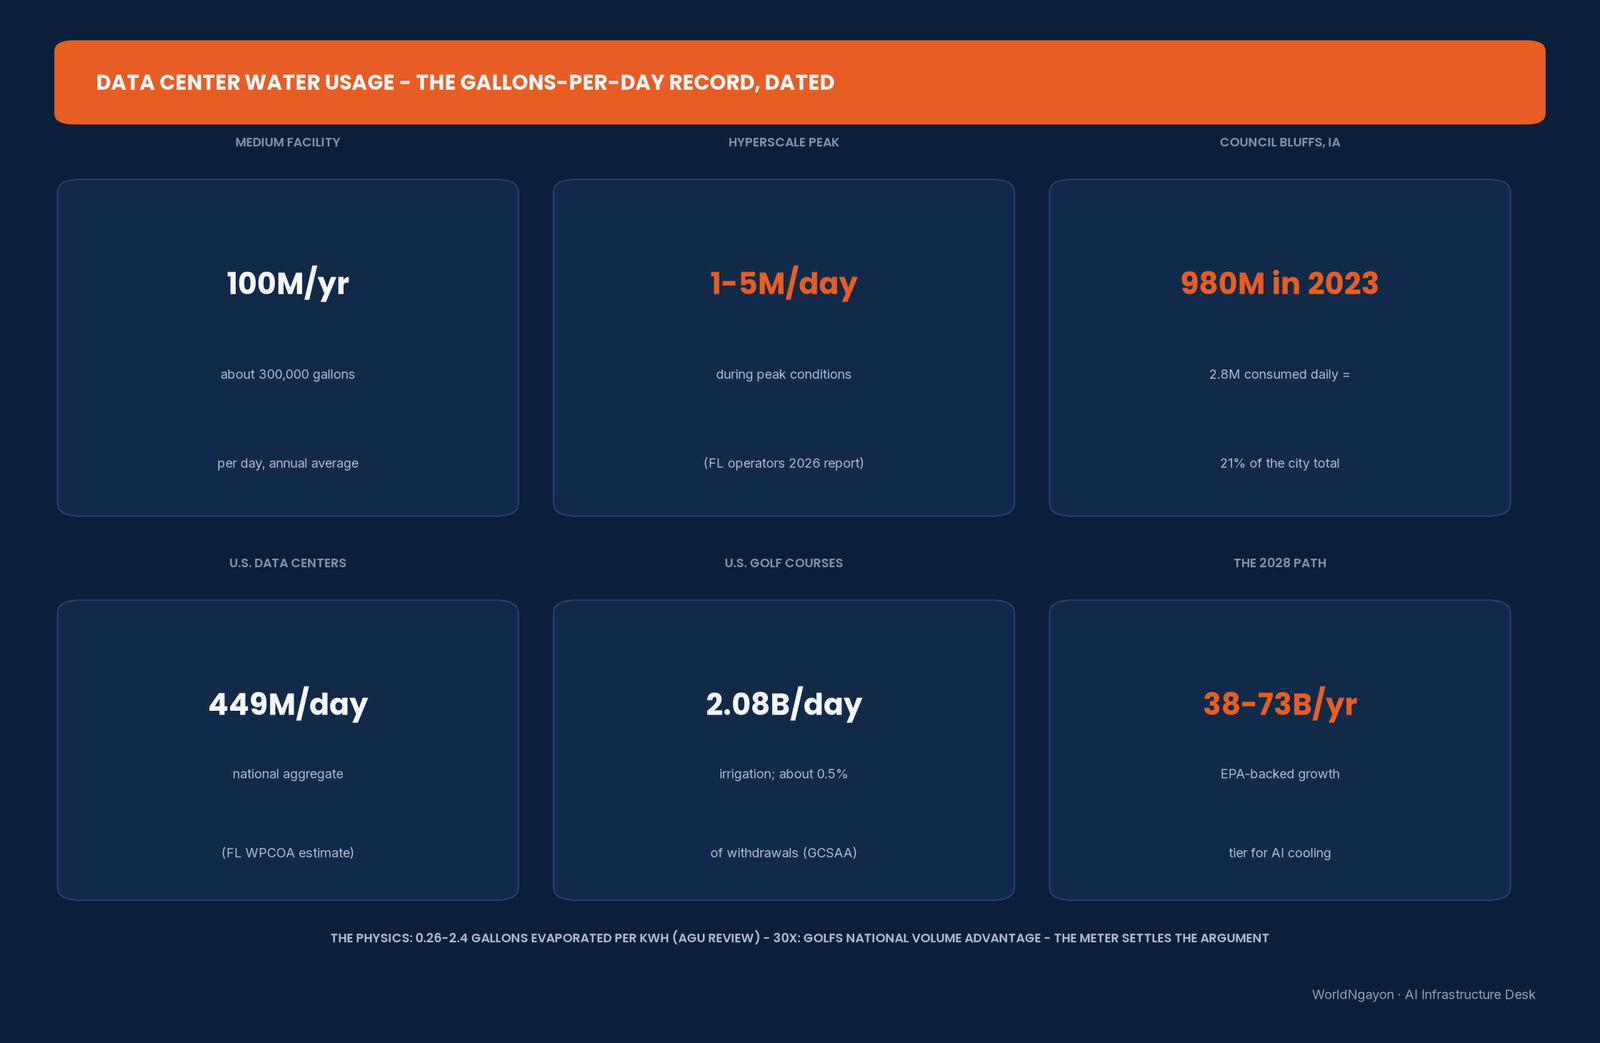
- 🔬 The peer-reviewed physics: cooling evaporates 0.26–2.4 gallons of water per kWh of server energy depending on climate and technology (AGU-published water-footprint research) — the direct (cooling) footprint sits on top of an indirect (energy) footprint that often dwarfs it.
- 📉 The trajectory: EPA-backed estimates put U.S. data-center water consumption on a path to 38–73 billion gallons by 2028 — and the transparency gap is the field’s own admission (Google is the biggest discloser of facility-level gallons; independent reporting suggests real totals run higher).
- 🛠 The efficiency record, dated: Microsoft reports water-use intensity down 25% versus its 2022 baseline with about 90% of its 2025 fleet on low-water or zero-water cooling; Amazon runs the lowest reported Water Usage Effectiveness of the major clouds — the cleanup happens, and the guide tells you what to watch.
Table of Contents
Is AI drinking the water? The plain answer is “less than golf, more than you think” — and The Gallons Per Day record is the number that settles every argument about it: the data center water usage question has an answer in gallons, and the answer is metered. The question arrived with the AI build-out: the campuses rising across the continent (and the world) carry cooling systems that evaporate real water from real watersheds, sometimes next to towns that noticed their wells working harder. This guide carries the verified record of data center water usage — the daily gallon figures by facility size, the golf-course comparison checked at the source (it is real, it is national, and it also misleads at the local level), the peer-reviewed physics of where the water actually goes, the named disclosures from Google, Microsoft and Amazon, and the 2028 trajectory the field’s own numbers map.
Data center water usage: the gallons-per-day record
The daily record of data center water usage, by facility class, as the water-operations record states them: the 2026 report of a state water and pollution-control operators’ association (Florida, cited across the July comparison report, carried by the Montgomery Advertiser) estimates a medium-sized data center uses about 100 million gallons annually — about 300,000 gallons a day — while large hyperscale facilities consume 1 million to 5 million gallons per day in peak conditions. The named flagship, measured at the utility: Google’s Council Bluffs, Iowa campus withdrew an average of 3.9 million gallons and consumed 2.8 million gallons per day (per the MOST Policy Initiative’s read of Google’s own environmental disclosures), and the peer-reviewed accounting puts its 2023 consumption at roughly 980 million gallons — about 21% of the city’s total water use, the equivalent of adding more than 4,700 residents to a town of that size. The national aggregate: an estimated 449 million gallons per day across U.S. data centers — the number of data center water usage to carry into every comparison.
the variance is the story’s honest texture — usage swings with climate and cooling design (evaporation multiplies in hot dry air; water-side economizers cut it in cool climates). The rack-density ladder explains why the thirst grows: watts per rack rose an order of magnitude, and evaporation follows kilowatt-hours.
300,000 to 5 million gallons a day, depending on the class of machine — and the flagship records now exist to check.
The golf-course comparison, checked honestly
The national layer — golf loses big: the Golf Course Superintendents Association’s figures put U.S. golf-course irrigation at about 2.08 billion gallons per day (also expressed as 500+ billion gallons a year by the Lincoln Institute’s compilation; both tiers sit inside the same order of magnitude), roughly 0.5% of U.S. water withdrawals — versus the 449-million-gallon daily estimate for data centers. The arithmetic: golf uses about 30× the water nationally that data centers do, a gap that holds even against 2028’s projected data-center totals (38–73 billion gallons/year, versus golf’s ~530 billion). The viral framing — golf drinks more than every data center combined, and faces zero backlash — is true nationally and has been checked against the field’s own worst-case projections.
The local layer — where the comparison misleads: 300 golf courses across a continent average their draw over watersheds with no AI load; a 5-million-gallon-per-day hyperscale campus sits in one watershed, next to neighbors whose taps share the pipe. One Google campus in Virginia consumed 173.2 million gallons in a year — the equivalent of about 1.2 golf courses — but served millions of people, while a golf course serving a few hundred members drinks comparable gallons with no regional supply chain at stake. Google’s worldwide data-center footprint equals roughly 41-43 golf courses (the Quartz ranking of its thirstiest sites carries the count). The comparison’s honest form: nationally, golf dwarfs data centers; locally, a flagship campus can be a town’s #1 water customer — that is exactly what happened in Council Bluffs (the peer-reviewed journal names the utility’s own #1-customer rank). The power-side capacity calendar carries the same local-vs-national lesson in megawatts.
the comparison is real water and wrong scale — run it nationally to rank industries, locally to judge a campus.
Where the water goes: cooling, chips and the footprint layers
The physics, peer-reviewed: the AGU-published water-footprint research divides the footprint into direct (Scope 1 — cooling; 0.26 to 2.4 gallons evaporated per kWh of server energy, set by climate and technology) and indirect (the electricity’s own water cost — power-plant cooling and fuel cycles, often larger than the direct tier). The direct tier is the water the campus pumps and evaporates; the indirect tier is the water grid operators evaporate to generate the electricity the campus burns. The guide’s reading rule: a facility’s water claims that count only the direct tier understate the footprint — the peer-reviewed record counts both, and its transparency gap (below) is precisely that the indirect tier rarely lands in a corporate disclosure.
The dated levers that cut data center water usage: cooling design sets the direct tier — water-side economizers (outside-air cooling in temperate climates) cut evaporative loads; immersion cooling cuts it harder (the physics carries the comparison); and low-water or zero-water designs (dry cooling with chillers) spend more electricity to save water — the trade is explicit, and Microsoft’s fleet record (below) shows it being chosen at scale. The upstream tier has its own records: chip fabrication is the wettest step in the stack (ultrapure-water intensive), and the chip-forge analyses carry that supply-side lane.
every kilowatt-hour carries a hidden water bill — 0.26 to 2.4 gallons evaporated per kWh, plus the generation tier behind the meter.
The names on the record: Google, Microsoft and Amazon
The disclosed record, tiered by what each company reports: Google is the largest disclosed data-center water user — its environmental reports carry the gallons (the Council Bluffs campus being the most-measured; the global footprint ≈ 41-43 golf courses), and the peer-reviewed field credits it as the transparency standard-setter while noting independent estimates run higher. Microsoft reports intensity progress — water-use intensity down 25% versus its 2022 baseline, with about 90% of its 2025 fleet on low-water or zero-water cooling — the design-choice tier made public. Amazon/AWS runs the lowest reported WUE (Water Usage Effectiveness, the industry’s liters-per-kilowatt-hour benchmark) among the major clouds, though its facility-level gallon disclosures trail Google’s. The grid, plainly: each major reports a different slice (volume, intensity, or WUE) — which is exactly why the field’s researchers call it a transparency problem, not a solved ledger (the money-trail discipline applies to disclosures: quote the tier, name the reporter).
the volumes belong to Google’s disclosures, the redesign to Microsoft’s fleet, the benchmark to AWS — three records, three shapes, one incomplete picture.
The transparency problem and the 2028 trajectory
The gap in data center water usage records, stated by the field’s own paper: the AGU water-footprint review documents what is missing — facility-level gallons are disclosed by one major, indirect footprints by almost none, and the siting decisions (which watershed, what drought condition) rarely face public review; the paper’s own record carries town-level cases (Council Bluffs’ #1-customer rank; Arizona campuses consuming millions of gallons daily per local reporting). The trajectory layer: EPA-backed estimates put U.S. data-center water consumption at 38–73 billion gallons by 2028 — a growing draw that raises the transparency stakes (the faster the build-out, the more a missing disclosure costs the affected town). The watchlist for the field, dated: facility-level gallon disclosures in new site filings; indirect-footprint accounting in the corporate reports; and the WUE benchmark’s spread from cloud-ops reporting into campus planning approvals.
the trajectory is measurable, the transparency is lagging it — the 2028 record will be written by whoever discloses first.
What it means for towns, buyers and the AI economy
For towns facing a campus: the verified question list is the gallons-per-day record itself — facility class (300,000 to 5 million gallons a day), source (municipal, wells, recycled), drought-condition behavior, and the indirect tier nobody discloses by default; the Council Bluffs case shows the questions have answers when the utility record is public.
For infrastructure buyers: the water budget is a siting input that the AI campus era prices directly, not an afterthought — the low-water fleet shift (Microsoft’s 90%-of-fleet record) prices water risk into the lease; the campuses with drought-vulnerable watersheds carry the risk premium. The energy-side buffer guides and the interconnection explainer carry the parallel constraints: power, water and bandwidth now price the same campus.
For global readers — including the Philippines’ own build-out: the tropical version of the record matters more here than the temperate one: hot humid climates run higher evaporative loads (the 2.4-gallon end of the peer-reviewed band), and watershed contention sharpens in island grids. The practical carry for OFW-relevant families watching local AI build-outs: the gallons-per-day number is the town’s negotiation anchor — and the international disclosure record (Google’s) is the precedent to demand locally.
Verdict: the water ask is real – and the records now exist
Data center water usage, settled as verified: medium facilities run about 100 million gallons a year; hyperscale peaks hit 1-5 million gallons a day; the national total (449 million gallons daily) trails golf’s 2.08 billion by roughly 30× — a comparison that is true nationally and misleading locally, exactly where the flagship case (Council Bluffs: 21% of a city’s water, 3,9 million withdrawn a day) showed a campus becoming a town’s #1 utility customer. The physics carries 0.26-2.4 gallons evaporated per kilowatt-hour; the fleet cleanup is real (Microsoft’s 25% intensity cut, AWS’s WUE benchmark, Google’s disclosure lead); and the trajectory (38-73 billion gallons by 2028) makes transparency the field’s defining fight. The water is not an argument — the gallon numbers are on the record; the ask is to keep counting them where the pipes meet the towns.
Frequently Asked Questions
How many gallons of water does a data center use per day?
Tiered by facility class: a medium-sized data center uses about 100 million gallons annually – roughly 300,000 gallons per day – while large hyperscale facilities can consume between 1 million and 5 million gallons per day during peak conditions, per 2026 state water-operators’ association estimates. The measured flagship: Google’s Council Bluffs, Iowa campus withdrew an average of 3.9 million gallons and consumed 2.8 million gallons per day, and about 980 million gallons across 2023 – roughly 21% of that city’s total water use.
Do golf courses use more water than data centers?
Nationally, yes by a wide margin: US golf courses use an estimated 2.08 billion gallons per day for irrigation (about 0.5% of national withdrawals) versus an estimated 449 million gallons per day for US data centers – golf drinks roughly 30 times more, and the gap holds against 2028’s projected data-center totals of 38-73 billion gallons per year. Locally the comparison can mislead: one hyperscale campus concentrates its draw in a single watershed next to neighbors – exactly the Council Bluffs case, where one Google campus became the city water utility’s number-one customer.
Why do data centers use water at all?
Mostly for cooling: evaporative cooling systems release heat by evaporating water, and the peer-reviewed water-footprint literature measures the direct tier at 0.26 to 2.4 gallons evaporated per kilowatt-hour of server energy depending on climate and technology. There is also an indirect tier – the water consumed generating the electricity the facility uses – which is often larger than the direct tier and rarely appears in corporate disclosures. Chip fabrication upstream adds its own ultrapure-water intensive footprint.
Which company's data centers use the most water?
Google is the largest disclosed data-center water user and the field’s transparency standard-setter: its reports carry facility-level gallons (the global footprint equals roughly 41-43 golf courses; single campuses measured at 173.2 million gallons a year in Virginia). Microsoft reports intensity rather than volume – water-use intensity down 25% versus its 2022 baseline, with about 90% of its 2025 fleet on low-water or zero-water cooling. Amazon’s AWS runs the lowest reported Water Usage Effectiveness of the major clouds, but facility-level gallon disclosures trail Google’s.
How fast is data center water consumption growing?
EPA-backed estimates put US data-center water consumption on a path to 38-73 billion gallons per year by 2028, from today’s estimated 449-million-gallons-per-day baseline (about 164 billion gallons a year at that daily rate – the growth projections describe ranges under different build-out assumptions). The trajectory makes facility-level transparency the field’s defining issue: the faster campuses arrive, the more a missing disclosure costs the affected town.
How can data centers reduce their water footprint?
Four proven levers: water-side economizers that use outside air instead of evaporation in temperate climates; immersion or direct-to-chip liquid cooling that removes heat with far less evaporative loss; low-water and zero-water designs that trade more electricity for water savings (Microsoft’s fleet shift being the dated, disclosed example); and sourcing – recycled water, non-potable supplies and reclaimed municipal water where regulations allow. The trade-off to watch: every water-saving design spends energy, which moves part of the footprint upstream into the power-generation tier.
Financial Disclaimer
This article is editorial analysis of publicly reported information, not investment or financial advice, and no outcome is promised. Water-use figures are as reported by the named sources and studies at the stated dates; verify locally before decisions. Facility operations vary.
The closing reading rule for data center water usage: every gallon count has a date and a domain — a facility class (the 300,000 to 5 million gallons a day), a national aggregate (the 449 million gallons), a season (the hot dry peak that multiplies evaporation), and a disclosure tier (the company record). The data center water usage story’s numbers earn trust the same way the industry’s power numbers do: by naming the class, the climate and the reporter. The gallons-per-day number is the town’s negotiating anchor; the peer-reviewed band is the engineer’s truth; and the corporate tier is the accountability record. Run all three and the AI-water argument settles the way infrastructure arguments should — with the metered record.
The last practical layer is seasonality: water draws are not flat. Evaporative loads multiply in the hottest weeks — the same weeks local grids strain for air conditioning — which is why the gallons-per-day record carries a peak-conditions qualifier, and why a campus’s annual average can look modest while a July afternoon looks enormous. Towns negotiating with an operator should ask for the peak-day curve, not the annual average; the difference is the season the aquifer remembers. The same seasonal logic explains why the corporate low-water fleet shifts (the Microsoft record) are measured in intensity — a number that compounds across every hot week it wins.
The per-economics note belongs here because the AI economy’s water arithmetic carries an order-of-magnitude spread: economic output per gallon evaporated runs far higher for a data center than for an irrigated lawn or fairway, which is the industry’s counterpoint to every local scare story — and it is also the reason the transparency fight is winnable: a facility that produces measurable output per gallon has every incentive to disclose the gallons honestly, because the ratio, not the raw volume, is its defensible claim. The gallon numbers are not the industry’s enemy; the missing meters are. Every campus that publishes its peak-day curve turns a scare story into an arithmetic lesson — the pattern the Council Bluffs records set for the whole field.
The record-keeping close for data center water usage: the AI build-out turned a utility question into a public one, and the field’s answer is now an archive anyone can check — the gallon records by facility class (300,000 to 5 million a day), the named flagship campus (Council Bluffs, at 2.8 million gallons consumed daily and 21% of its city’s total in 2023), the peer-reviewed evaporation band (0.26 to 2.4 gallons a kilowatt-hour), the disclosed corporate ledger (Google’s volumes, Microsoft’s intensity record down 25% with about 90% of its 2025 fleet on low-water or zero-water cooling, AWS’s Water Usage Effectiveness benchmark), and the 2028 trajectory (38-73 billion gallons). Data center water usage is no longer a rumor; it is a metered record — and the meter is where every future argument will be settled. The gallon count that matters next is the one the next campus publishes, and the reading rule is this guide’s own: ask for the peak-day curve, not the annual average.
- akcp.com/2026/08/17/truth-about-data-water-footprint-of-data-centers
- agupubs.onlinelibrary.wiley.com/doi/full/10.1029/2025AV002140 — the AGU-published water-footprint research
- thenetworkinstallers.com/blog/data-center-water-usage — the verified question list
External sources linked in this article, in order of first mention. Spotted an error or a broken link? Tell us.
Cite this pagePublished Nov 5, 2026
Agron, E. (2026, November 5). Is AI Drinking the Water? How Many Gallons a Data Center Uses Per Day. WorldNgayon. https://worldngayon.com/data-center-water-usage/
Agron, Edmon. “Is AI Drinking the Water? How Many Gallons a Data Center Uses Per Day.” WorldNgayon, 5 Nov. 2026, worldngayon.com/data-center-water-usage/.
Agron, Edmon. “Is AI Drinking the Water? How Many Gallons a Data Center Uses Per Day.” WorldNgayon, November 5, 2026. https://worldngayon.com/data-center-water-usage/.
Agron, E. (2026) ‘Is AI Drinking the Water? How Many Gallons a Data Center Uses Per Day’, WorldNgayon, 5 November. Available at: https://worldngayon.com/data-center-water-usage/.
E. Agron, “Is AI Drinking the Water? How Many Gallons a Data Center Uses Per Day,” WorldNgayon, Nov. 5, 2026. [Online]. Available: https://worldngayon.com/data-center-water-usage/
@online{agron2026datacenter,
  author       = {Agron, Edmon},
  title        = {{Is AI Drinking the Water? How Many Gallons a Data Center Uses Per Day}},
  year         = {2026},
  date         = {2026-11-05},
  organization = {WorldNgayon},
  url          = {https://worldngayon.com/data-center-water-usage/},
  urldate      = {}
}TY - ELEC AU - Agron, Edmon TI - Is AI Drinking the Water? How Many Gallons a Data Center Uses Per Day T2 - WorldNgayon PY - 2026 DA - 2026/11/05/ UR - https://worldngayon.com/data-center-water-usage/ Y2 - ER -
Cite the version you read; the page may be updated. Zotero and Mendeley can also import this page directly.