

Table of Contents
Key Takeaway
- 🌊 The wave, sized: global data-center capex flows toward $31.6 trillion cumulative over 2026–2050 (PwC’s outlook) — rising from ~$800 billion in 2026 to $1.8 trillion a year by 2050; Gartner’s separate AI-investment forecast counts $2.7 trillion in 2026 alone (JP Morgan’s analysts note the estimates keep getting revised up, from $650B to $800B+ for the year — since January).
- 🏗️ Who the AI money pays first: the capex race, computed — Amazon $131.8B, Microsoft $115.9B, Alphabet $91.4B, Meta $69.7B, Oracle $55.7B of 2026 capital spend on record (wafergraph’s SEC-based dataset).
- 👷 The real paychecks: US construction needs 349,000 net new workers in 2026 (456,000 in 2027); data-center electricians earn a 25–30% premium over standard commercial rates — from ~$62K median toward $120K+ base, with union overtime packages pushing some mission-critical crews past $260K.
- ⚡ The chokepoints set the pay: electrical systems are 40–50% of data-center construction cost; commissioning delays on a 60-megawatt facility cost ~$14.2 million per month; specialized roles take 75+ days to fill.
- 🏦 And the financing layer eats quietly: AI capex ran 33% of hyperscaler operating cash flow in 2023 — an estimated 93% in 2026; the gap is bridged by raises and structured credit — the money that pays everyone downstream.
AI money moves in waves you can measure — not in vibes, in filings, spending prints and payroll tables — and 2026 is the year the wave became the single biggest investment program on Earth. This desk’s $2.7 trillion Gartner number is one lens on it; PwC’s multi-decade outlook counts $31.6 trillion cumulative over a generation; and the most honest framing of all is where the money LANDS: hyperscalers’ capex budgets (computed from SEC filings), the construction crews converting budgets into buildings (349,000 workers short this year), the electricians whose premium over commercial rates is now 25–30% and climbing, and the financing layer Wall Street stands behind — the SPVs and raises this desk documented in the Broadcom-Anthropic structure. Where the AI money goes is no longer a prediction question; it is an allocation question — and this piece walks the actual recipients, paycheck by paycheck, with every figure dated and sourced.
Where the AI Money Goes First: the Capex Race, Computed
The recipients at the top of the wave are the hyperscalers themselves — the buyers whose own budgets ARE the wave. Wafergraph’s SEC-filing-based dataset (market data as of October 23–24, 2026) computes $464.6 billion of combined hyperscaler capex, ranked: Amazon $131.8B, Microsoft $115.9B, Alphabet $91.4B, Meta $69.7B, Oracle $55.7B — followed by the supply-side racers putting capex into their own capacity: Micron $30.7B, TSMC $30.3B, Intel $14.6B, Apple $12.7B, CoreWeave $10.3B. Read that table as the buildout’s skeleton: five buyers deploy nearly $465 billion between them, mostly onto chips, servers, networking, the power and cooling infrastructure that feeds them — and JP Morgan Asset Management’s mid-year analysis adds the discipline the market now applies: higher capex only drove stronger share performance this earnings season when matched with higher revenue estimates — “investors are now conditioning the reward for additional capex spending on evidence of greater final demand.” The desk’s translation for the reader who invests or freelances along this chain: the buyers’ budgets are the demand curve; every downstream paycheck below is a division of those budgets.
The Real AI Money Paychecks: Construction, Electricians, Commissioning
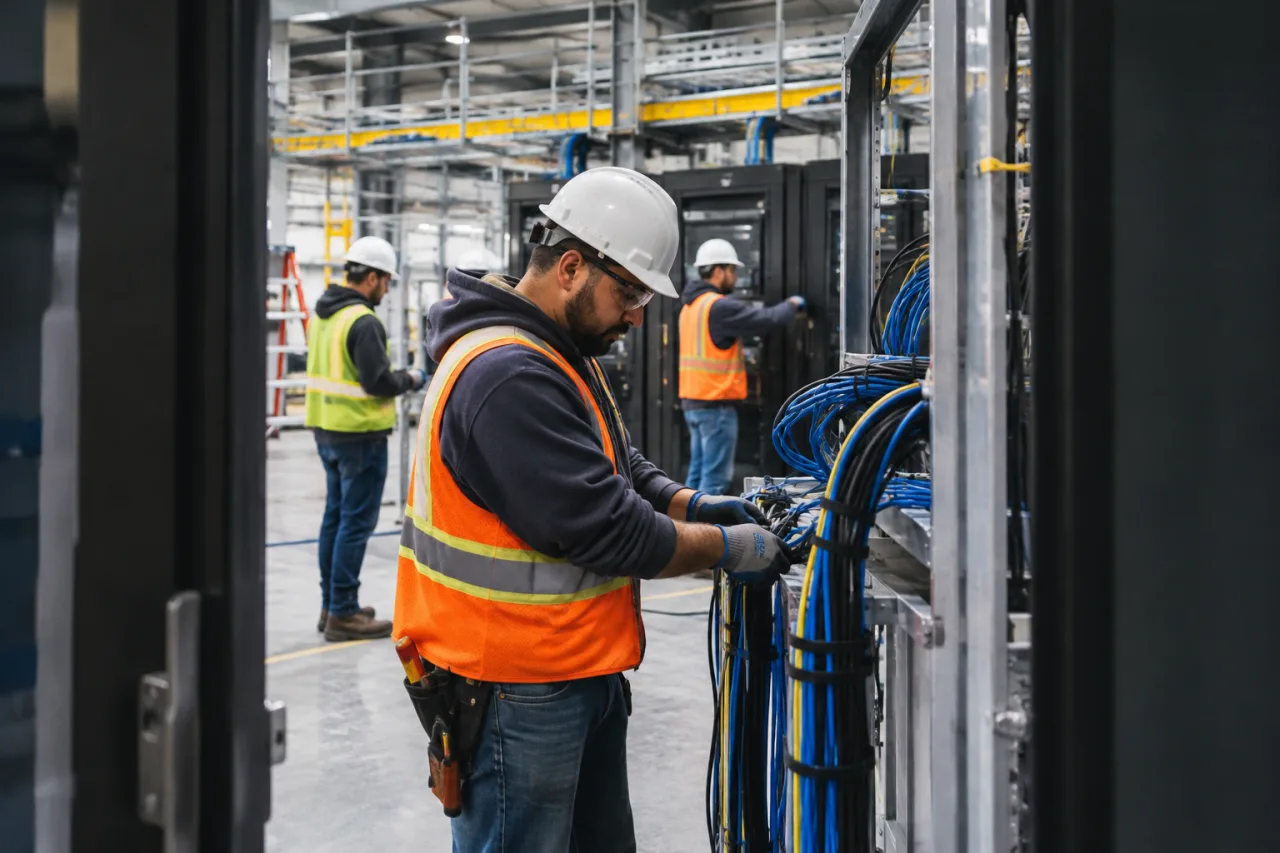
Where the AI money lands on crews — and the labor data says the landing is the tightest since the postwar buildouts. From the federal and industry sources, dated: construction spending on data centers crossed a $50 billion annualized rate for the first time in April 2026 — up roughly 27% year on year (US Census construction-spending series); the AGC’s 2026 outlook scores data centers at a 57% net optimism reading — the highest of any segment and the only category up double digits; and Associated Builders and Contractors counts the industry’s need at 349,000 net new workers in 2026, rising to 456,000 in 2027. The pay table that follows is the AI money arriving in wage form — from the recruiting-industry placement data (The Birmingham Group’s 40-market salary survey) and mission-critical market analyses:
| Labor lane | 2026 print | Why the AI money pays it |
|---|---|---|
| Standard electrician | ~$62,350 median base | the baseline the premium compares against (BLS-based market data) |
| Data-center electrician | ~$120,000+ base | medium-voltage, liquid-cooling and controls scarcity — the 25–30% premium lane |
| Mission-critical crew packages | $200K–260K+ with overtime/per diem | union overtime, rotation premiums, retention — the national-coverage headline number |
| Commissioning engineers | booked out; leverage at project end | the role a 60MW delay makes costly at ~$14.2M/month |
| Time-to-fill | 75+ days for specialized roles | the scarcity clock every schedule rides |
Electrical systems now run 40–50% of total data-center construction cost; North American construction labor costs climbed 8–12% year over year; and hyperscale owners compete directly for crews capable of precision electrical work — the AI money’s most concrete paychecks in 2026 are signed by people whose names never appear in AI-model press releases (The Birmingham Group; iRecruit’s commissioning analysis; industry workforce studies)).
The Bottlenecks That Set the Pay: Memory, Power, Cooling
Where a wave concentrates, wages price it. The supply chain’s priced bottlenecks, per the analysts: high-bandwidth memory — where JP Morgan notes “bottlenecks are allowing companies to achieve strong pricing power and generate robust profits”; power — the binding constraint on buildout speed, the reason the desk’s copper-and-power coverage and the hyperscale leasing data (Northern Virginia at 0.3% vacancy, Dallas-Fort Worth’s 716.7 MW under construction 88% preleased, per CBRE’s 2026 global trends report) read the way they do; cooling — the liquid-cooling retrofit market that turns mechanical trades into the scarcest hands in the building. And the equipment-vs-buildings split matters most at the horizon: PwC’s outlook projects the ICT equipment share of total data-center capex rising from ~70% in 2026 to 93% by 2050 — the wave’s permanent shape is chips and the machinery of chips, with buildings as the shell the equipment passes through on its multi-year replacement cycle.
The Financing Layer: Who Gets Paid Without Lifting a Chip
The quiet payee of the wave is the money layer itself. The cash-flow math: AI capex consumed ~33% of the hyperscalers’ cash from operations in 2023 — JP Morgan pegs the 2026 estimate at 93% — and the gap between cash generation and compute appetite is what summoned the financing era of AI money: Meta’s upsized $25 billion equity sale at five-times demand (a $98 billion AI war-chest), the Broadcom-Anthropic SPV with its four Wall Street names and vendor residual support, the neocloud credit buildouts renting rented compute. The AI money’s payees at this layer: origination fees, spread, and structuring salaries — plus the risk taken on balance sheets that the lessees’ revenue curves eventually have to justify. The desk has covered that layer directly this week — the AI money-circle analysis carries the $63 billion structure line by line — and the honest summary stands: the financing layer gets paid whether or not the chips’ ultimate returns cooperate, which is exactly why the circular-financing debate exists at all.
The Honest Caveats: What the AI Money Wave Owes Its Skeptics
The bubble counterweight, with its own numbers: JP Morgan’s charting analysis counts the market’s repricing — 20% of S&P 500 capitalization (the AI cohort) generating 40% of this quarter’s earnings GROWTH; 65% of S&P companies mentioning AI on calls but only 2% quantifying productivity impact; consensus EPS revised UP 17% (2026) and 15% (2027) this year as estimates chased the capex reality. The downside scenario, written by PwC: restrictive scenarios on chip access cut cumulative 2026–2050 capex by around $6 trillion (from $31.6T to $25.5T) — the tail risk is policy and supply-chain, not sentiment alone. The labor-side caveat, stated plainly: the premium jobs cluster where the megawatts do — Oklahoma and West Texas pay relocation costs because local trade depth is thin; a wave this concentrated is a wage gift for the credentialed and a regional strain for everyone else. And the desk’s build-and-earn lane adds this: the buildout’s paychecks flow to trades, engineers, commissioning pros and financiers — the AI-training-jobs tier discussed in this desk’s earlier earnings-lane analyses is a different, thinner slice of the same wave.
What Would Change This Guide: the Invalidation Ledger
- A capex-guide miss at a hyperscaler — the first major budget cut or guidance pull-back would mark the wave’s demand curve; the December-rate environment (the Fed’s live node this week) is the financing backdrop it rides.
- Electrician premium deflating — a construction-spend print below trend (Census monthly) or an oversupply of crew capacity would flatten the paycheck table.
- Power constraints easing — grid connections or on-site generation arriving faster than modeled would shift the chokepoint wages toward cooling and network.
- The restriction scenario activating — export-control tightening materializing as PwC’s modeled chain friction would re-run the map’s geometry (regional winners shift, per its own analysis).
What the Evidence Supports, by Reader Situation
Education desk, not an advisory service — decision inputs for career and business moves, never instructions.
- If you’re a trades or MEP professional: the verified pay table says the data-center lane carries a 25–30% premium at entry and structural demand behind it — the skill stack (medium-voltage, liquid cooling, commissioning) sits where the money actually concentrates; verify your market’s rates against the survey data before quoting your own.
- If you’re deciding where a business or freelance practice should aim: the recipients list is the target list — data-center construction services, commissioning talent networks, power and cooling sub-trades, and the financing layer’s service providers are hiring through the scarcity; the desk’s AI-jobs guides — the US market map, Singapore and the Gulf — carry the white-collar layer of the same wave.
- If you invest along the buildout: the honest frame is JP Morgan’s own: the recipients of capex spending “enjoy a smoother ride” than the buyers whose returns the market now conditions on final demand — but the 93%-of-cash-flow concentration is also the system’s balance-sheet risk, and the money-circle analyses carry that ledger.
FAQ: Where the AI Money Actually Goes
How big is the AI investment wave in 2026?
Sized by scope: Gartner’s AI-investment forecast puts 2026 at $2.7 trillion globally (rising to $3.6 trillion in 2027); PwC’s data-center-specific outlook counts ~$800 billion of 2026 capex rising to $1.8 trillion annually by 2050 ($31.6 trillion cumulative over 2026–2050); JP Morgan notes consensus estimates for 2026 were revised from $650 billion to over $800 billion since January — the estimates chase the spending upward.
Who are the biggest spenders of AI money in the buildout?
The top five hyperscaler capex budgets on SEC-filing data: Amazon $131.8B, Microsoft $115.9B, Alphabet $91.4B, Meta $69.7B, Oracle $55.7B — followed by Micron ($30.7B), TSMC ($30.3B) and the field; combined hyperscaler capex computes to $464.6 billion.
Why are data-center electricians earning so much now?
The AI money’s labor premium: electricians remain scarce (349,000 net new construction workers needed in 2026; retirements accelerate the gap), the work is mission-critical and power-dense (electrical = 40–50% of DC construction cost), and a commissioning delay costs roughly $14.2M/month on a 60MW facility — so base pay moved from ~$62K toward $120K+, with union overtime packages reaching $260K in top markets.
What role earns the most unusual premium in the boom?
Commissioning engineers and specialized field leaders — booked across multiple projects, leverage-heavy near project completion, and 75+ days to fill even at contract rates; supply of hands who have already delivered a live data-hall turnover is the tightest pool of all.
Is the AI buildout financed or self-funded with AI money?
Increasingly financed: AI capex ran 33% of hyperscaler operating cash flow in 2023 and an estimated 93% in 2026 — the difference bridges through equity raises (Meta’s $98B war-chest at 5× demand), structured credit (the $63B Broadcom-Anthropic SPV), and private-credit participation — the financing layer earns whether the returns cooperate or not, and that asymmetry is the bubble debate’s live wire.
What could shrink the wave?
The modeled tail risks: chip-access restrictions (PwC sizes the restrictive scenario at ~$6 trillion of cumulative shortfall, 2026–2050), a demand-side capex pull-back at any top hyperscaler, and rate-market conditions that raise borrowing costs for the credit-heavy layer — each invalidates pieces of this map on its own print.
Financial Disclaimer
This article is for general information and education only. It is not financial, investment, legal or tax advice, and it does not recommend the purchase, sale or holding of any security, or any career, business or investment decision. Spending figures, wage data and forecasts change without notice; every figure was sourced from the cited filings, surveys and studies dated 2026 and must be re-verified before any decision. WorldNgayon does not hold any position in the companies or securities discussed, and no content on this site should be acted upon without independent verification and, where appropriate, advice from licensed professionals.
- pwc.com/gx/en/1/services/consulting/technology/data-centre-outlook.ht… — PwC’s outlook
- am.jpmorgan.com/dk/en/asset-management/institutional/insights/portfol…
- Official census.gov/construction/c30/c30index.html — US Census construction-spending series
- news.agc.org/economics/2026-construction-industry-outlook — the AGC’s 2026 outlook
- abc.org/News-Media/News-Releases/abc-construction-industry-must-attra… — Associated Builders and Contractors counts
- thebirmgroup.com/data-center-construction-boom-2026 — 40-market salary survey
- irecruit.co/insights/electrician-shortage-2026-impact-data-center-pay — iRecruit’s commissioning analysis
- ainvest.com/news/data-center-electricians-earning-260k-infrastructure… — industry workforce studies
- cbre.com/insights/reports/global-data-center-trends-2026 — CBRE’s 2026 global trends report
- am.jpmorgan.com/ch/en/asset-management/per/insights/market-insights/i… — JP Morgan pegs the 2026 estimate at
External sources linked in this article, in order of first mention. Spotted an error or a broken link? Tell us.
Cite this pagePublished Oct 29, 2026
Agron, E. (2026, October 29). Where the AI Money Goes: Inside the Biggest Investment Wave on Earth and Its Real Paychecks. WorldNgayon. https://worldngayon.com/ai-money-trail/
Agron, Edmon. “Where the AI Money Goes: Inside the Biggest Investment Wave on Earth and Its Real Paychecks.” WorldNgayon, 29 Oct. 2026, worldngayon.com/ai-money-trail/.
Agron, Edmon. “Where the AI Money Goes: Inside the Biggest Investment Wave on Earth and Its Real Paychecks.” WorldNgayon, October 29, 2026. https://worldngayon.com/ai-money-trail/.
Agron, E. (2026) ‘Where the AI Money Goes: Inside the Biggest Investment Wave on Earth and Its Real Paychecks’, WorldNgayon, 29 October. Available at: https://worldngayon.com/ai-money-trail/.
E. Agron, “Where the AI Money Goes: Inside the Biggest Investment Wave on Earth and Its Real Paychecks,” WorldNgayon, Oct. 29, 2026. [Online]. Available: https://worldngayon.com/ai-money-trail/
@online{agron2026aimoney,
  author       = {Agron, Edmon},
  title        = {{Where the AI Money Goes: Inside the Biggest Investment Wave on Earth and Its Real Paychecks}},
  year         = {2026},
  date         = {2026-10-29},
  organization = {WorldNgayon},
  url          = {https://worldngayon.com/ai-money-trail/},
  urldate      = {}
}TY - ELEC AU - Agron, Edmon TI - Where the AI Money Goes: Inside the Biggest Investment Wave on Earth and Its Real Paychecks T2 - WorldNgayon PY - 2026 DA - 2026/10/29/ UR - https://worldngayon.com/ai-money-trail/ Y2 - ER -
Cite the version you read; the page may be updated. Zotero and Mendeley can also import this page directly.