

Table of Contents
Key Takeaway
- 📊 Interactive in Chat: Gemini interactive visualizations can now be generated — tables, grids, simulations, and 3D models — directly within your chat. No external tools, no separate apps.
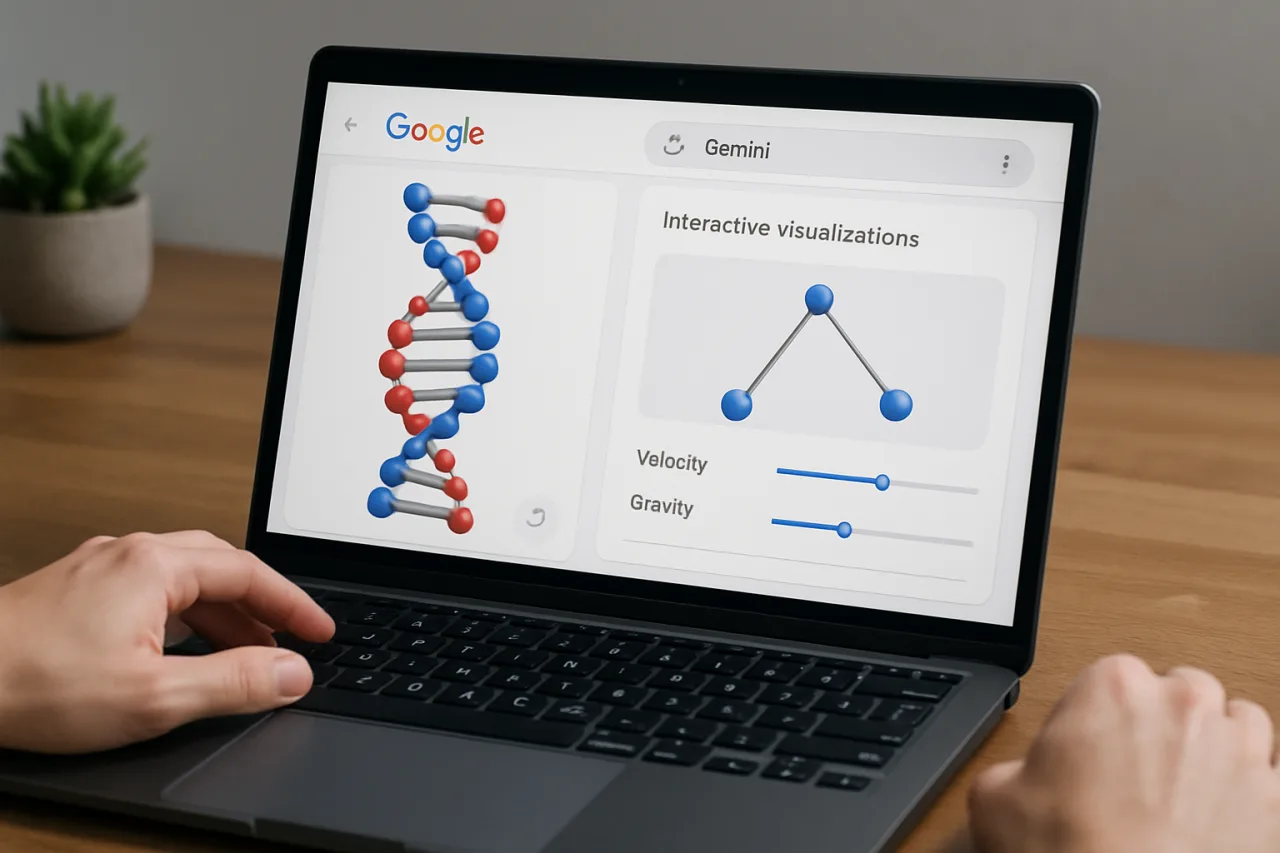
- 🧪 Real Simulations: Ask Gemini to “show me how a double pendulum works” and you get a working physics simulation with sliders for initial velocity and gravity. Ask about DNA and you can rotate a 3D model in your browser.
- 🏢 Available Now: The feature rolled out to all Google Workspace customers, Workspace Individual subscribers, and users meeting minimum age requirements on August 24, 2026.
- 💡 How to Use It: Select the Pro model in Gemini, then ask it to “show me” or “help me visualize” any complex concept. Gemini generates an interactive widget you can manipulate directly in the chat.
- ⚡ Why It Matters: Gemini interactive visualizations change how professionals understand complex topics — from static text answers to hands-on, manipulable models that make abstract concepts tangible.
Google just changed what “searching for an answer” means. On August 24, 2026, the company announced that Gemini interactive visualizations are now available to all Google Workspace customers — meaning you can ask Gemini to “show me how DNA works in 3D” and get a rotatable, zoomable DNA model directly in your chat. Or ask about a pendulum and get a working physics simulation with sliders for initial velocity and gravity strength. Or request an interactive table to understand cash burn rates. The era of AI giving you a paragraph of text and a static diagram is ending. The era of AI giving you something you can touch, manipulate, and explore has arrived.
According to the Google Workspace Updates blog, the feature transforms how users interact with complex topics. “Previously, responses were largely just text with static diagrams. Now, we’re delivering functional simulations that can help you better understand the topic you’re asking Gemini about.” The shift from static to interactive is not cosmetic — it changes the relationship between the user and the information. A paragraph about how a double pendulum works tells you what happens. A simulation of a double pendulum lets you see it happen, change the variables, and watch the outcome shift in real time.
What Gemini Interactive Visualizations Actually Do
According to Google’s blog, Gemini interactive visualizations can produce several types of interactive content directly in chat:
- 3D Models: Ask Gemini to “show me how DNA works in 3D” and you get a 3D DNA structure you can rotate and zoom into. Ask about a molecule and you can rotate it to see it from any angle.
- Physics Simulations: Ask about a pendulum, orbital mechanics, or a double-slit experiment and you get a working simulation with adjustable parameters. When exploring how the moon orbits the Earth, you can manually adjust sliders for initial velocity and gravity strength to instantly see how those variables create a stable orbit.
- Interactive Tables: Ask about cash burn rates or any topic that can be modeled as a table, and Gemini generates an interactive table you can manipulate — not just read.
- Grids and Explorable Models: Complex systems that would require paragraphs to explain can be rendered as interactive grids or models that the user explores at their own pace.
The key innovation is that these are not pre-built visualizations. Gemini generates them on demand, tailored to the specific question. If you ask “show me how fractals work,” Gemini creates a visualization specific to that request. If you ask “show me how the double pendulum works,” you get a different visualization. Each response is custom-generated for your question, not pulled from a library of pre-made diagrams.
How to Use Gemini Interactive Visualizations: Step by Step
Using Gemini interactive visualizations is straightforward — the feature requires no setup, no installation, and no separate app. Here is how to get started:
- Go to gemini.google.com. The feature is available in the Gemini app, which you can access through any web browser.
- Select the Pro model. Google’s blog specifies that you need to select the Pro model in the prompt bar. The interactive visualizations are powered by the more capable model variant.
- Ask Gemini to “show me” or “help me visualize.” The trigger phrases are “show me” and “help me visualize” — for example, “Show me how a double pendulum works” or “Help me visualize how DNA replication works.” These prompts signal to Gemini that you want a visual, interactive response rather than a text answer.
- Interact with the result. Once Gemini generates the visualization, you can rotate 3D models, adjust simulation parameters, zoom in and out, and explore the model at your own pace. The interaction happens directly in the chat — no pop-ups, no external tools.
- Refine your question. If the visualization doesn’t show what you need, refine your prompt. Ask for different parameters, a different aspect of the concept, or a different type of visualization. Gemini will regenerate the interactive model based on your refined request.
Practical Use Cases for Professionals
Gemini interactive visualizations are not just for students learning physics. They have practical applications across professional fields:
For financial professionals: Ask Gemini to visualize cash burn rates, compound interest scenarios, or portfolio risk distributions. Instead of reading a paragraph about how different interest rates affect a loan, you can adjust the rate slider and watch the outcome change in real time. This is particularly useful for explaining financial concepts to clients who may not have a finance background — an interactive model is more intuitive than a spreadsheet — especially when explaining investment concepts to Filipino professionals.
For engineers and developers: Ask Gemini to visualize data structures, algorithm behavior, or system architectures. An interactive 3D model of a binary tree, a hash table, or a network topology diagram that you can rotate and explore is more useful than a static diagram. For AI security protocols, an interactive simulation of how a sandbox isolation works could help teams understand why certain safeguards matter.
For healthcare professionals: Ask Gemini to show how a drug interacts with a receptor, how blood flows through the heart, or how a disease progresses through different stages. The 3D models can be rotated to see anatomical structures from any angle — something a textbook diagram simply cannot do.
For educators and trainers: Interactive visualizations are a natural fit for education. Instead of telling students about orbital mechanics, show them a simulation and let them adjust the variables themselves. The hands-on experience of manipulating a model creates deeper understanding than reading about it. This aligns with the broader AI adaptation theme — professionals who learn to use interactive AI tools will communicate complex concepts more effectively than those who rely on text alone.
For business analysts: Ask Gemini to create interactive data visualizations — market trend simulations, customer journey maps, or supply chain models. The ability to adjust parameters and see outcomes in real time makes interactive models more useful for scenario planning than static reports.
Limitations and What to Watch
While Gemini interactive visualizations are impressive, they have limitations that professionals should understand:
Not available for all account types. According to Google’s original April 2026 announcement, the feature was “not yet available for Education and Workspace accounts” at launch. The August 24 update extended availability to Workspace customers, but usage limits apply. If you are on a free Google account, you may face usage caps.
Requires the Pro model. Google’s blog specifies that you need to select the Pro model in the prompt bar. If you are using a standard or free model tier, the interactive visualization feature may not be available. This means the feature is gated behind Google’s premium offering — consistent with the broader trend of AI companies reserving their most advanced features for paying users.
Accuracy depends on the model. The interactive visualizations are generated by the AI model, which means they are subject to the same accuracy limitations as any AI-generated content. A physics simulation that looks correct may have subtle errors in its calculations. A 3D model of a molecule may not perfectly represent the actual molecular structure. Professionals should use these visualizations as exploratory tools — to understand the shape of a problem — and verify specific values against authoritative sources before making decisions.
Not a replacement for professional tools. Gemini interactive visualizations are excellent for understanding concepts and exploring scenarios. They are not replacements for professional simulation software, CAD tools, or data visualization platforms. A financial model built in Excel or a physics simulation built in MATLAB will be more accurate, more customizable, and more auditable than what Gemini generates in chat. Use Gemini for exploration; use professional tools for production.
The Bigger Picture: Interactive AI Is the New Standard
The release of Gemini interactive visualizations signals a broader shift in how AI tools are evolving. The first generation of AI chatbots gave you text. The second generation gave you text with images. The third generation — which we are now entering — gives you interactive, manipulable objects that you can explore and modify. This is not a feature announcement; it is a paradigm shift in how humans interact with AI-generated knowledge.
The shift matters because it changes the role of AI from an answer provider to an exploration partner. When you ask Gemini for a paragraph about how orbital mechanics works, your relationship with the information is passive — you read what Gemini wrote. When you ask Gemini to show you an interactive simulation of orbital mechanics, your relationship is active — you adjust the variables, you see the outcomes, you develop intuition that a paragraph cannot provide. This is the difference between being told how something works and being given the tools to understand how it works.
For professionals, the implication is clear: the AI tools that will be most valuable in the coming years are not those that give you the best text answers, but those that let you explore, manipulate, and interact with the information. Gemini interactive visualizations are an early example of this shift. Expect similar features from OpenAI, Anthropic, and other AI companies in the coming months — the race to make AI output interactive, not just informative, has begun.
Frequently Asked Questions About Gemini Interactive Visualizations
What are Gemini interactive visualizations?
Gemini interactive visualizations are a feature of the Gemini app that generates custom, interactive visual content — including 3D models, physics simulations, interactive tables, and grids — directly within your chat. Instead of receiving a text answer with a static diagram, you get a manipulable model you can rotate, zoom, adjust, and explore.
How do I use Gemini interactive visualizations?
Go to gemini.google.com, select the Pro model in the prompt bar, and ask Gemini to “show me” or “help me visualize” a complex concept. For example, “Show me how a double pendulum works” or “Help me visualize how DNA works in 3D.” Gemini will generate an interactive visualization that you can manipulate directly in the chat.
When did Gemini interactive visualizations become available?
Google first announced the feature on April 9, 2026, for personal Gemini users. On August 24, 2026, the feature was extended to all Google Workspace customers, Workspace Individual subscribers, and users meeting minimum age requirements. The rollout is now complete for both Rapid Release and Scheduled Release domains.
Do I need a paid Google account for Gemini interactive visualizations?
You need access to the Pro model in the Gemini app, which is part of Google’s premium offering. The feature is available to all Google Workspace customers and Workspace Individual subscribers. Free Google account users may have usage limits. Google’s blog specifies that you must select the Pro model in the prompt bar to access interactive visualizations.
What can I visualize with Gemini interactive visualizations?
You can generate 3D models (like DNA structures, molecules), physics simulations (like pendulums, orbital mechanics, double-slit experiments), interactive tables (like cash burn rate models), and grids or explorable models for complex systems. Each visualization is custom-generated based on your specific question — there is no library of pre-made diagrams.
Are Gemini interactive visualizations accurate?
The visualizations are generated by the AI model and are subject to the same accuracy limitations as any AI-generated content. Physics simulations may have subtle calculation errors, and 3D models may not perfectly represent actual structures. Use Gemini interactive visualizations as exploratory tools to understand the shape of a problem, and verify specific values against authoritative sources before making decisions.
Can I use Gemini interactive visualizations for professional work?
Yes, but with limitations. Gemini interactive visualizations are excellent for exploring concepts, explaining complex topics to clients, and scenario planning. They are not replacements for professional simulation software, CAD tools, or data visualization platforms. Use Gemini for exploration and understanding; use professional tools for production work that requires accuracy and auditability.
How do Gemini interactive visualizations compare to other AI tools?
As of August 2026, Gemini is the first major AI chatbot to offer interactive, manipulable visualizations directly in chat. Other AI tools like ChatGPT and Claude primarily generate text and static images. The shift from static to interactive output represents a new paradigm in AI-generated content, and similar features are expected from competitors in the coming months.