

Table of Contents
Palantir Stock Fell Two Sessions After Record Results: What Investors Should Actually Weigh
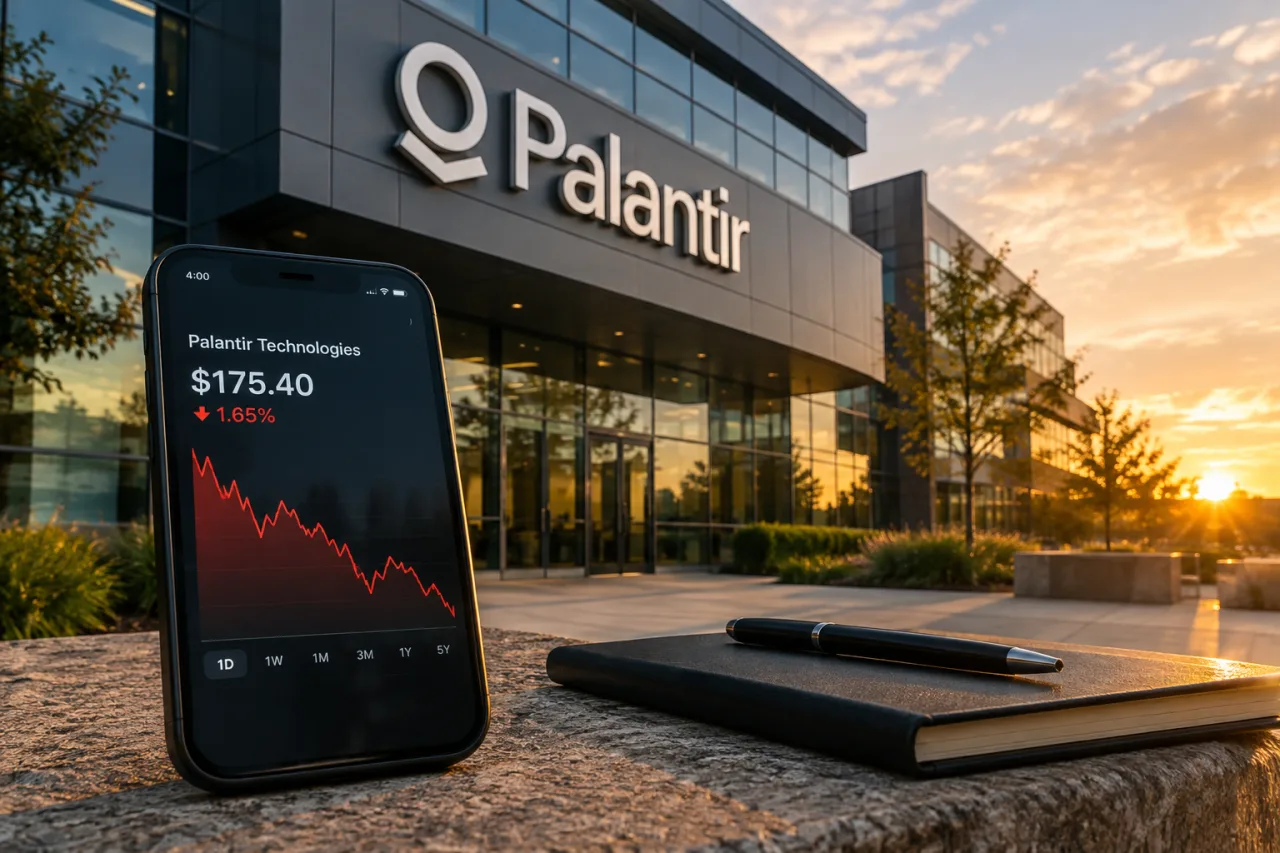
Q3 2026 (quarter ended September 30; released after the U.S. market close on Monday, November 2, 2026): revenue $2.313 billion, up 96% year over year — Palantir’s first quarter above $2 billion | Rule-of-40 score 158% (96% revenue growth + 62% adjusted operating margin) | RPO $4.9 billion, up 88% year over year, flat sequentially | total remaining deal value $13.4 billion, up 55% year over year, 2% sequentially | total contract value booked $2.918 billion, up 6% year over year | the Palantir stock reaction: $175.40 (-1.65%) on November 3, $171.70 (-2.11%) on November 4, roughly -3.7% across the two sessions from November 2’s $178.34 close
Key Takeaway
- 📈 Palantir stock’s Q3 2026 was exceptional by any software standard: revenue up 96% to $2.313 billion, U.S. commercial revenue up 148% to $984 million — passing U.S. government revenue ($953 million) for the first time in company history — and a Rule-of-40 score of 158%.
- 📉 The sell-off was about the future, not the past quarter: the stock closed down 1.65% at $175.40 on November 3 (its first session after the release) and fell another 2.11% to $171.70 on November 4 — roughly -3.7% across the two sessions — while the Nasdaq Composite advanced 0.83% on November 3.
- 🧮 The disputed numbers are about contract growth, not contract depletion: total contract value booked grew 6% year over year ($2.918 billion), remaining performance obligations held at $4.9 billion (up 88% year over year, flat sequentially), and total remaining deal value reached $13.4 billion (up 55% year over year, +2% sequentially) — four different measures, each answering a different question about future revenue.
- ⚖️ The valuation at the November 4 close: about $413.7 billion of market value on 2.40–2.41 billion actual shares outstanding at $171.70 — roughly 48.5 times Palantir’s own FY2026 revenue guidance of $8.532 billion, with the Motley Fool carrying a forward earnings multiple near 86 at the November 3 close. Both figures are reproducible arithmetic; neither is an endorsement.
- 🎯 Sell-side records on Palantir stock were split: RBC Capital kept its Underperform while raising its target from $90 to $130 (its note cited 2% sequential remaining-deal-value growth, flat RPO and management’s acknowledgment of shorter-than-usual contracts); Morgan Stanley moved to $233, Citi to $265, Cantor Fitzgerald to $207 — each dated to the November 3 coverage.
Palantir Technologies reported the strongest quarter of its life as a public company on Monday, November 2, 2026, after the U.S. market close: revenue of $2.313 billion, up 96% from a year earlier; U.S. commercial revenue of $984 million, up 148%; and a Rule-of-40 score of 158%, calculated by the company as revenue growth plus adjusted operating margin. The stock’s reaction to that record was not a celebration. In the first session after the release, shares of Palantir stock closed down 1.65% at $175.40 while the Nasdaq Composite gained 0.83%; on November 4 they fell further, closing at $171.70, down 2.11% — roughly a 3.7% decline across two sessions from the November 2 close of $178.34.
Alex Karp, Palantir’s co-founder and chief executive, framed the quarter around “Sovereign AI”: “Every institution — government and commercial — is rapidly being forced, voluntarily or not, into one of these two categories,” he said in the release. Investors’ hesitation after that quote is the useful part of this story. The Q3 financial results answered several questions clearly; the market decline says the market is still asking a different question — what the Palantir stock price already assumes about future growth. This article separates those two things: what the quarter established, what the decline says about expectations, and what an investor can and cannot conclude from the numbers.
The customer-base record frames the valuation question. Palantir sells three software platforms: Foundry, the commercial platform that turns a company’s data into working analytical models; Gotham, the government equivalent used by defense and intelligence customers; and AIP, which embeds large language models into those workflows, with Ontology serving as the component that links the software to the organization’s actual data. Contracts in this business tend to run long and deep: switching costs are high because the platforms sit inside operational processes, not adjacent to them.
The composition shift matters for the risk profile. U.S. commercial revenue of $984 million passed U.S. government revenue of $953 million for the first time in the company’s history — Karp announced the milestone in the release himself. Deal volume supports the commercial read: 212 deals of at least $1 million, 107 of at least $5 million, and 64 of at least $10 million closed in the quarter, with U.S. commercial remaining deal value at $6.52 billion, up 79% year over year. The = one customer = the U.S. government = the = a commercial base of hundreds of enterprise buyers. Together these shifts define Palantir stock’s risk profile. It now has: less concentration on a single payer, but more exposure to how enterprise customers behave when budgets tighten.
The Numbers From Q3 2026
- Growth: revenue $2.313 billion, up 96% year over year and 20% from Q2; aggregate U.S. revenue $1.937 billion, up 119%. Management raised full-year 2026 revenue guidance to $8.530–8.534 billion (a 91% growth rate) and U.S. commercial guidance to more than $3.56 billion (at least 143% growth).
- Profitability: GAAP income from operations $1.085 billion, a 47% margin; adjusted income from operations $1.427 billion, a 62% margin; GAAP net income $1.128 billion, a 49% margin ($0.44 GAAP EPS, equal to adjusted EPS — versus an analyst consensus near $0.41 per stocktitan’s 8-K summary). Stock-based compensation was $319 million — an expense investors should track because it is real cost to shareholders even though it is excluded from adjusted earnings.
- Cash: $10.4 billion in cash, cash equivalents and U.S. Treasuries on the balance sheet at September 30 — a stock of liquidity, not a quarter’s flow. Cash from operations in the quarter was $1.205 billion (52% margin) and adjusted free cash flow $1.216 billion (53% margin), with full-year adjusted free cash flow guided to $4.8–5.0 billion.
- Contract measures — the four numbers the sell-off turned on: total contract value booked in the quarter $2.918 billion, up 6% year over year; remaining performance obligations $4.9 billion, up 88% year over year and flat sequentially; total remaining deal value $13.4 billion, up 55% year over year and 2% higher sequentially; net dollar retention 165%, up 800 basis points from Q2. Each measure covers a different slice of future revenue — the next section explains the differences.
- The Palantir stock price record: a $178.34 regular-session close on November 2 (the release came after the close), $175.40 (-1.65%) on November 3 against a Nasdaq Composite up 0.83%, and $171.70 (-2.11%) on November 4. Cumulatively, about -3.7% across two sessions.
RPO, remaining deal value, and contract value are not the same number — three figures dominated the market discussion of this quarter, and confusing them produces wrong conclusions.
Three figures dominated the market discussion of this quarter, and confusing them produces wrong conclusions.
Remaining performance obligations (RPO): $4.9 billion, up 88% year over year and flat sequentially. RPO counts revenue that Palantir has been contracted to deliver but has not yet recognized. Flat RPO quarter over quarter does not mean the backlog is shrinking; it means the value of signed, undelivered work held steady while recognized revenue grew 96%. Per management on the earnings call, RPO primarily reflects the commercial business because of how government contracts are structured.
Total remaining deal value (RDV): $13.4 billion, up 55% year over year and 2% sequentially. RDV is a broader forward-revenue measure than RPO — it includes signed contracts as well as other committed arrangement value. It grew 55% year over year while revenue grew 96%, and management and the sell side flagged that deals this quarter run shorter than usual.
Total contract value booked: $2.918 billion, up 6% year over year — the weakest of the growth lines and the number the decline centered on. TCV booked counts the total potential lifetime value of agreements signed during the quarter. A 6% bookings increase against 96% revenue growth means recent signings are not, on a year-over-year basis, keeping up with the pace of recognition.
What this does and does not imply about Palantir stock: slower bookings growth than revenue growth is not automatically evidence that previously signed contracts are running out. Revenue in a given quarter recognizes portions of multi-year deals signed earlier; a quarter of weak bookings can still leave total obligable value (up 55% year over year) far larger than a year ago. The genuine watch item is the reverse relationship: the contract duration shortened this quarter (management acknowledged it, and RBC’s note recorded it), and if bookings growth keeps lagging recognition for several quarters, the near-term revenue line would eventually face a tougher comparison. One quarter establishes neither outcome. The correct conclusion range runs from “a growth-deceleration signal worth monitoring” to “a temporary lull in large signings” — the two-session price decline says markets are weighing the first more heavily.
Valuation at the November 4 Close, With the Arithmetic Shown
Palantir’s valuation is the reason Palantir stock fell after a record quarter. Here is a reproducible calculation chain using only figures from the company’s own release and dated market records.
Step 1 — the share count (actual shares outstanding, not the EPS denominator). Palantir’s most recent 10-Q cover page reports 2,300,713,329 Class A + 101,340,151 Class B + 1,005,000 Class F = 2,403,058,480 shares outstanding as of July 27, 2026 — call it 2.40 billion. Market-data services record 2.41 billion shares outstanding at the November 4 close (Yahoo Finance: 413,710,745,600 ÷ 171.70 = 2.409 billion. Important distinction: the ~2.57 billion weighted-average diluted figures used in EPS computations include unvested equity awards and options; they are an earnings-accounting denominator, not the count of shares that exist. Market capitalization uses the actual outstanding count.)
Step 2 — the market value. At the November 4 close of $171.70: 2.40–2.41 billion shares outstanding × $171.70 ≈ $413.7 billion — the figure Yahoo Finance records for that date ($413.71 billion). At the November 3 close of $175.40, the same arithmetic gives roughly $421.5 billion (matching stockanalysis.com’s November 3 record). At both closes, market value sits above $400 billion.
Step 3 — the price-to-guidance-sales ratio. $413.7 billion ÷ the FY2026 revenue guidance midpoint ($8.532 billion) = about 48.5 times projected full-year revenue. At the November 3 record it is ≈ 49.4. Call it roughly 48–49 times Palantir’s own full-year 2026 guidance. This is not a consensus-estimate multiple — it uses the company’s own raised guidance as the denominator.
Step 4 — the earnings multiple (attributed, dated). The Motley Fool’s November 3 market-recap carried a forward earnings multiple of about 86 for the stock at that close. That figure combines the market price with analyst forward earnings estimates, which are themselves projections; the exact inputs are not disclosed in the recap, which is why it is carried here as a dated third-party figure rather than recomputed. What can be said arithmetically is that any earnings multiple above 80 embeds earnings several years ahead growing substantially faster than the stock price — the mechanical definition of paying for future growth.
Step 5 — what a price target means against this record. RBC Capital’s $130 target maintained after the results implies roughly 24% downside for Palantir stock from the November 4 close — the analyst’s own estimate, not a prediction. Targets above the current price ($207 Cantor, $233 Morgan Stanley, $262 J.P. Morgan initiating October 29, $265 Citi) imply upside of 21% to 54%. The spread between the lowest and highest recent targets — $130 to $265 — is itself the clearest statement of how differently trained analysts value the same disclosed figures.
None of these numbers is a verdict. They are the reproducible arithmetic that lets an investor decide what the price assumes, rather than arguing about whether the stock “feels” expensive.
What the Sell-Side Records Actually Said (Each Dated)
RBC Capital — Underperform maintained, target $130 raised from $90 (dated November 3, per TipRanks/TheFly and the TradingView record). Analyst Rishi Jaluria’s note described a solid quarter (revenue up 96%) while stating the firm’s caution in specific terms: total RDV grew just 2% from Q2, RPO was flat sequentially, and management acknowledged shorter-than-usual contract duration. The $131→$130 raise still leaves the target below the market — roughly 24% below the November 4 close. This is the clearest published articulation of the bear case: not disagreement about the quarter, but a different reading of what the contract measures say about Palantir stock’s future revenue.
Ratings and targets raised across the board after the November 2 release (each dated to November 2–3 coverage): Morgan Stanley to $233 from $205; Citi to $265 from $250; Piper Sandler to $235 from $231; Cantor Fitzgerald maintained its Neutral while raising to $207 from $156. Across the most recent thirty days of published notes, targets span $130 to $265 — a range wider than some entire market segments trade in a year.
The record supports one conclusion: on Palantir stock there is no published consensus. Any claim that “the market knows Palantir stock is overvalued” fails immediately against this record, and so does the reverse. What exists is a set of dated, attributed, competing estimates; an investor’s job is to understand what each one’s arithmetic assumes, not to average them into a verdict.
The Investor Read: Questions to Weigh, Stated as Education
Whether Palantir stock belongs in a portfolio — and in what size — is a decision that depends on things this article cannot know: an investor’s other holdings, time horizon, cost basis, and tolerance for the kind of two-session decline shown above. What this record can offer is a checklist of the questions that matter, in order:
- Business performance versus market expectations: Q3 established that the business is growing fast and profitable. The price decline shows that, at a market value above $400 billion, expectations embedded in the price exceed what even a 96%-growth quarter delivered for the stock. Those are separate facts; only the second one is about the price.
- What would change the outlook: for the bear case, several quarters of bookings growth lagging recognition, or shortening contract duration becoming the norm; for the bull case, an acceleration in large multi-year signings that restores bookings above recognition growth, supported by the raised guidance. The Q4 report (Q4 revenue guided to $2.649–2.653 billion) carries the next datapoint, not the final word.
- What an individual share price move proves: almost nothing, short-term. A -1.65% session against a rising market says sellers that day weighed contract-growth deceleration more than they weighed the guidance raise — and short-term moves in Palantir stock prove little on their own. Volume roughly 2.3× the 30-day average on that session says the disagreement was active, not passive.
- Position sizing, educationally: a stock such as Palantir, whose two-session record spans -3.7% on strong results, is a candidate for the portfolio-management basics, whatever one’s view of the business — sizing a position so that no single report’s outcome is decisive, keeping the position consistent with a written plan, and not funding any stock purchase from money needed for obligations. Those principles apply to every holding of this volatility class, on both sides of the debate.
Dates and Numbers to Watch Next
- Q4 2026 revenue guidance: $2.649–2.653 billion — the next recognition datapoint, which the market will compare against the bookings growth line.
- The next bookings print (Q4): whether total contract value growth accelerates from 6% toward the revenue growth rate — the datapoint both the RBC record and the current Palantir stock debate turn on.
- Full-year 2026: revenue guidance $8.530–8.534 billion, adjusted free cash flow guidance $4.8–5.0 billion — guidance the company raised this quarter; delivery is now the baseline for both sides’ arguments.
- Contract duration disclosures: management acknowledged shorter-than-usual contracts this quarter; whether that persists is a material input to both the RPO and the remaining-deal-value interpretations — and to how the market prices Palantir stock next.
Frequently Asked Questions
Why did Palantir stock fall after record quarterly results?
The decline centered on contract-growth measures, not the quarter’s results: total contract value booked grew 6% year over year, RPO was flat quarter over quarter, and management acknowledged shorter-than-usual contract duration — while revenue grew 96%. Markets weighed that gap against the price already embedded in a stock valued above $400 billion. The stock closed -1.65% at $175.40 on November 3 and -2.11% at $171.70 on November 4, roughly -3.7% across the two sessions.
Is the -1.65% November 3 close still the relevant market reaction?
It was the first session after the November 2 earnings release (delivered after Monday’s close), and that session set $175.40. Since publication timing matters: this article now covers November 4’s $171.70 close (-2.11%) as the most recent session, bringing the cumulative post-earnings move to roughly -3.7%. Both closes are dated market records carried per session; prices change in every subsequent session.
Do flat RPO and 6% bookings growth mean Palantir is running out of contracts?
No — that is not what the measures say. Remaining performance obligations of $4.9 billion are up 88% year over year (flat only quarter over quarter, against a revenue line that grew 96%), and total remaining deal value of $13.4 billion is up 55% year over year. Slower bookings growth than recognition growth is a deceleration signal to monitor, made more important by shorter contract durations this quarter — not evidence that signed contracts are being depleted. Whether the gap persists across several quarters is what the next reports must establish.
How is Palantir valued at the current price?
Reproducible arithmetic: Palantir’s 10-Q cover reports about 2.40 billion shares actually outstanding (2,403,058,480 as of July 27, 2026, across Class A, B and F); at the November 4 close of $171.70 that is about $413.7 billion of market value (Yahoo Finance records 413,710,745,600 for that date); measured against the FY2026 revenue guidance midpoint of $8.532 billion, roughly 48.5 times projected full-year revenue. The Motley Fool carried a forward earnings multiple around 86 at the November 3 close (a dated, attributed figure combining price with analyst forward-earnings estimates). All figures are for education, and none is a recommendation.
What is the Rule of 40, and what is Palantir’s score?
The Rule of 40 says a software company’s revenue growth plus profit margin should exceed 40% combined. Palantir’s Q3 2026 score is 158% — calculated as 96% revenue growth plus a 62% adjusted operating margin — up three points sequentially and its 13th consecutive quarter of expansion. Nearly quadruple the threshold, it is the single best summary of why the company’s growth-and-profit combination is unusual; it says nothing about what the stock is worth.
What is the “Sovereign AI” thesis Karp keeps referring to?
Karp’s argument is that institutions — governments and enterprises — are being forced into one of two categories: those building their own AI capability on their own data, and those without it. Palantir sells the platforms (Foundry, Gotham, AIP, Ontology) that operationalize models on customer-controlled data. This quarter’s commercial-over-government revenue crossover is his evidence the thesis is broadening. It is the company’s framing of its market position — investors should weigh it against the independent contract-growth data above.
Can investors outside the United States act on this analysis?
The analysis is educational and jurisdiction-neutral: the figures are the company’s own disclosures and dated market records; the price moves apply to a NASDAQ-traded instrument (PLTR). Investors elsewhere face their own access routes, currencies, fees and tax treatment, which the figures here do not address. Nothing in this article is individualized investment advice, and every figure should be re-verified on live sources before any decision.
Financial Disclaimer: This article is an educational market-analysis feature, not investment advice, and no action on any stock mentioned is recommended. Figures come from the company’s November 2, 2026 earnings release (issued after the U.S. close) and the Q3 2026 Business Update presentation, dated market-data records for the November 3 and November 4, 2026 sessions, and analyst notes dated to their publishers’ coverage; prices, multiples and ratings change between sessions and must be verified on live sources before any decision. worldngayon.com is not affiliated with Palantir Technologies or any broker or research firm named and accepts no liability for outcomes from actions taken on this content.
Correction of Record — November 5, 2026
An earlier version of this article carried material errors: a Rule-of-40 score reported as 15 in the opening data strip (correct: 158%); the earnings release dated November 1 (correct: issued after the U.S. close on November 2, 2026); an 85–99-times-earnings valuation range that was not independently reproducible (the article now shows the full valuation arithmetic chain and attributes the dated forward-multiple figure); a comparison that implied contracts were being depleted because bookings growth lagged revenue growth (the measures and their differences are now stated explicitly); and a price record covering only November 3 (the November 4 session — $171.70, -2.11% — is now incorporated, with cumulative figures). A later correction (November 5): the market-capitalization calculation used the quarter’s weighted-average diluted share count (~2.57 billion, the EPS denominator) where market cap requires actual shares outstanding (about 2.40–2.41 billion per the 10-Q cover page and market-data records); market value and the price-to-guidance-sales ratio were rebuilt on the correct denominator ($413.7 billion; roughly 48.5 times FY2026 revenue guidance). Natural-language defects from the earlier version have been removed throughout. The slug, post ID, publication date, featured image and unaffected content are preserved.
Sources on record: Palantir’s Q3 2026 results release (Business Wire, November 2, 2026); Palantir’s Q3 2026 Business Update presentation; CNBC’s November 2 results coverage; Palantir’s 8-K summary (StockTitan); the earnings-call record (Yahoo Finance); the RBC Capital note (TipRanks/TheFly, dated); the TradingView analyst-flow record; the November 3 market recap (Gotrade) and the November 3 session record (Yahoo Finance syndication of the Motley Fool recap) — the November 4 close is carried in the Fool’s live quote module (NASDAQ, as of 4:00 PM ET 11/04/26). Related WorldNgayon coverage: the AI-bubble timing analysis, the US-vs-PSE stock comparison, and the AI-selloff explainer.
- businesswire.com/news/home/20261101396214/en/Palantir-Reports-Q3-2026…
- investors.palantir.com/files/Palantir%20-%20Q3%202026%20Business%20Up… — Palantir’s Q3 2026 Business Update presentation
- cnbc.com/2026/11/02/palantir-pltr-earnings-q3-2026.html — CNBC’s November 2 results coverage
- stocktitan.net/sec-filings/PLTR/8-k-palantir-technologies-inc-reports… — Palantir’s 8-K summary (StockTitan)
- finance.yahoo.com/markets/stocks/articles/palantir-technologies-inc-p… — the earnings-call record (Yahoo Finance)
- tipranks.com/news/the-fly/palantir-price-target-raised-to-130-from-90… — the RBC Capital note (TipRanks/TheFly, dated)
- tradingview.com/news/tradingview:6549ba130eca2:0-rbc-capital-maintain… — the TradingView analyst-flow record
- heygotrade.com/en/news/palantir-pltr-stock-news-november-4-2026 — the November 3 market recap (Gotrade)
- finance.yahoo.com/markets/stocks/articles/stock-market-today-nov-3-22…
External sources linked in this article, in order of first mention. Spotted an error or a broken link? Tell us.
Cite this pagePublished Nov 5, 2026
Agron, E. (2026, November 5). Palantir Stock Fell Two Sessions After Record Results: What Investors Should Actually Weigh. WorldNgayon. https://worldngayon.com/palantir-stock/
Agron, Edmon. “Palantir Stock Fell Two Sessions After Record Results: What Investors Should Actually Weigh.” WorldNgayon, 5 Nov. 2026, worldngayon.com/palantir-stock/.
Agron, Edmon. “Palantir Stock Fell Two Sessions After Record Results: What Investors Should Actually Weigh.” WorldNgayon, November 5, 2026. https://worldngayon.com/palantir-stock/.
Agron, E. (2026) ‘Palantir Stock Fell Two Sessions After Record Results: What Investors Should Actually Weigh’, WorldNgayon, 5 November. Available at: https://worldngayon.com/palantir-stock/.
E. Agron, “Palantir Stock Fell Two Sessions After Record Results: What Investors Should Actually Weigh,” WorldNgayon, Nov. 5, 2026. [Online]. Available: https://worldngayon.com/palantir-stock/
@online{agron2026palantirstock,
  author       = {Agron, Edmon},
  title        = {{Palantir Stock Fell Two Sessions After Record Results: What Investors Should Actually Weigh}},
  year         = {2026},
  date         = {2026-11-05},
  organization = {WorldNgayon},
  url          = {https://worldngayon.com/palantir-stock/},
  urldate      = {}
}TY - ELEC AU - Agron, Edmon TI - Palantir Stock Fell Two Sessions After Record Results: What Investors Should Actually Weigh T2 - WorldNgayon PY - 2026 DA - 2026/11/05/ UR - https://worldngayon.com/palantir-stock/ Y2 - ER -
Cite the version you read; the page may be updated. Zotero and Mendeley can also import this page directly.